Maintaining a healthy automated test environment for the long term requires more than making sure your tests pass. You and your team need to keep your finger on the pulse of your test automation setup to detect any signs of decline as soon as it happens. It's much easier to fix processes when issues arise than weeks or months later since you'll need to backtrack to find any points of failure.
One of the critical parts of successful test automation is having robust reporting available to the team. Reports allow you to collect your automated test results and surface any problems as soon as they occur. Useful reporting tools will let your team monitor your test suite's health and quickly point out where any issues exist so it can get fixed as soon as possible.
Many testing frameworks and tools like continuous integration services contain different types of reporting that you can use. However, it's somewhat tedious and cumbersome to put together reports from various systems, especially when they're from distinct places. For instance, your team might have different development environments, like a JavaScript framework using a Python or Ruby backend on the server. Gathering the data needed from each of these tools and presenting them in a standardized way is challenging to maintain in the long haul, especially when new testing tools get added to the mix.
Recently, I stumbled upon a test automation tool called ReportPortal that solves most of these issues. ReportPortal is an open-source test automation dashboard that labels itself as an "AI-Powered" service. It provides a single place to aggregate all your automated test runs no matter which tools you use, along with features such as real-time analytics and integration with bug tracking services. It also integrates some machine learning by analyzing your test tun results and giving you different ways to fix problems as they occur.
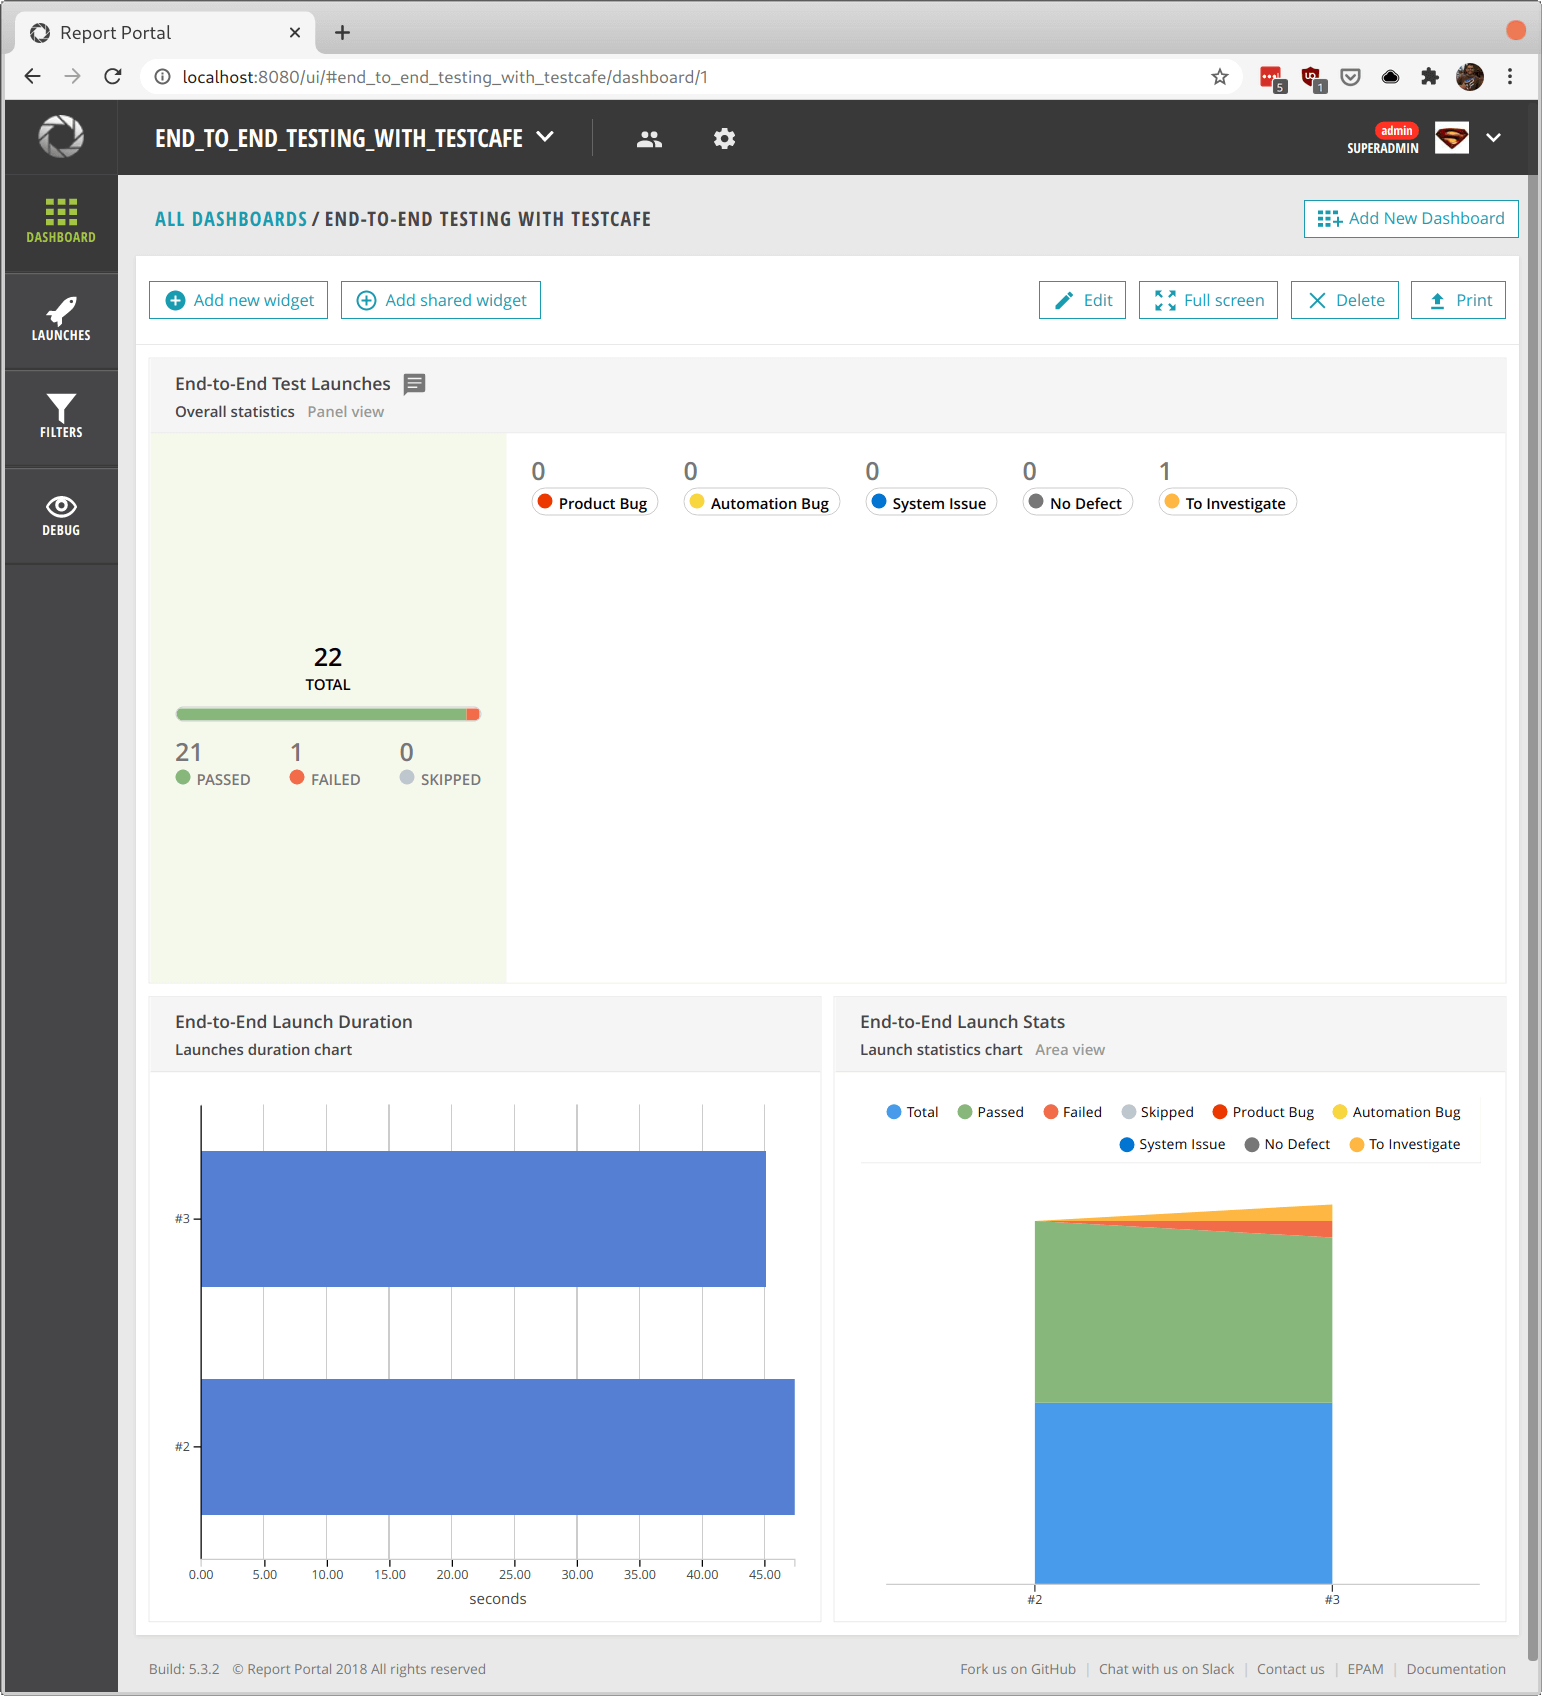
This article will give you a brief overview of ReportPortal and demonstrate how simple it is to integrate with a test automation library using the end-to-end testing framework TestCafe.
Why use ReportPortal?
Using a test automation tool such as ReportPortal can give you and your team a massive boost in productivity by having a single place for your test results. No matter which testing framework you use, ReportPortal can collect and aggregate the details of your test runs. This feature allows you to standardize your reporting across programming languages, services, and frameworks.
ReportPortal also makes it easy to integrate with your existing tools and frameworks. They have plenty of officially-supported integrations with some of the most popular testing libraries, like JUnit, Cucumber, Mocha, Robot Framework, and dozens of others. You can also find many integrations for other tools maintained by developers and testers. No matter what your organization uses for testing, you're likely to find an easy way to send your automated test results to ReportPortal.
Once ReportPortal has your test results, it allows you to take action on any test failures that happen during execution. Any failed tests will get tagged with a "To Investigate" label to signal that someone on the team should check the failure and decide what to do next. For example, you can integrate ReportPortal with different tools such as Jira or Rally and send the test failure details over to keep track of it.
Over time, you can set up dashboards with details about your automation and monitor your test automation's health at a glance. The dashboards are entirely customizable through different widgets that you can share with the entire team. Some examples of the widgets you can set up are viewing the trend of failures across your test suites, common test failure details, and filtering by test types such as API or end-to-end tests.
For power users, you can leverage ReportPortal's machine learning to automatically classify your results as they come to help you isolate problems swiftly. For example, ReportPortal can instantly find multiple test failures that all failed for the same reason or label repeated failures in a specific way to help your team prioritize these issues quickly.
Finally, ReportPortal is entirely free and open-source, which is excellent for small teams and startups. You can set it up using your in-house infrastructure using Docker or Kubernetes and not worry about expensive fees or worrying about how third-parties use your data.
Now that you know some of the basic functionality and benefits that ReportPortal provides let's see how it works in practice with some basic hands-on examples.
ReportPortal in action with TestCafe
ReportPortal is a standalone web application that you can install on any server. The official installation guide recommends using Docker or Kubernetes for easy setup since it requires a few dependencies. However, you can also install the tool on any Linux server without Docker or Kubernetes if you prefer. This article won't go through the installation process and will assume you have ReportPortal up and running.
For the examples in this article, we'll use the test suite built for the book End-to-End Testing with TestCafe. The test suite covers over ten end-to-end tests used as examples throughout the book. These tests are available on GitHub, although you will need to purchase the book to gain access to the web application used to successfully execute the tests.
ReportPortal currently does not have official support for the TestCafe testing framework. Fortunately, a reporter plugin called testcafe-reporter-reportportal allows you to easily send your test execution results from TestCafe to an instance of ReportPortal. Like other TestCafe plugins, you can install the testcafe-reporter-reportportal plugin using npm in your project:
npm install testcafe-reporter-reportportalBefore running your tests with this reporter, you will need to configure the plugin via environment variables. These variables contain the settings for the testcafe-reporter-reportportal plugin to know where to send your test run results. The environment variables you can set up are the following:
REPORT_PORTAL_BASE_URL(Required): The URL pointing to your ReportPortal instance.REPORT_PORTAL_TOKEN(Required): The API token for a valid ReportPortal user. You can find this information in your account settings.REPORT_PORTAL_PROJECT_NAME(Required): The name of your project in ReportPortal.REPORT_PORTAL_LAUNCH_NAME: A name to identify for your test runs (also known as "launches") in ReportPortal. If not specified, the plugin will use the project name as the launch name.REPORT_PORTAL_TAGS: Optional tags, separated by commas, to label your tests in the test run.REPORT_PORTAL_DESCRIPTION: An optional description for the test run.
ReportPortal itself doesn't need too much setup once it's up and running on your servers. You'll likely want to set up a project and fetch your API token, and that's all you would need to begin sending test run details over. For the examples in this article, I'll use a project named end_to_end_testing_with_testcafe (project names do not allow spaces) and identify by test runs with "End-to-End".
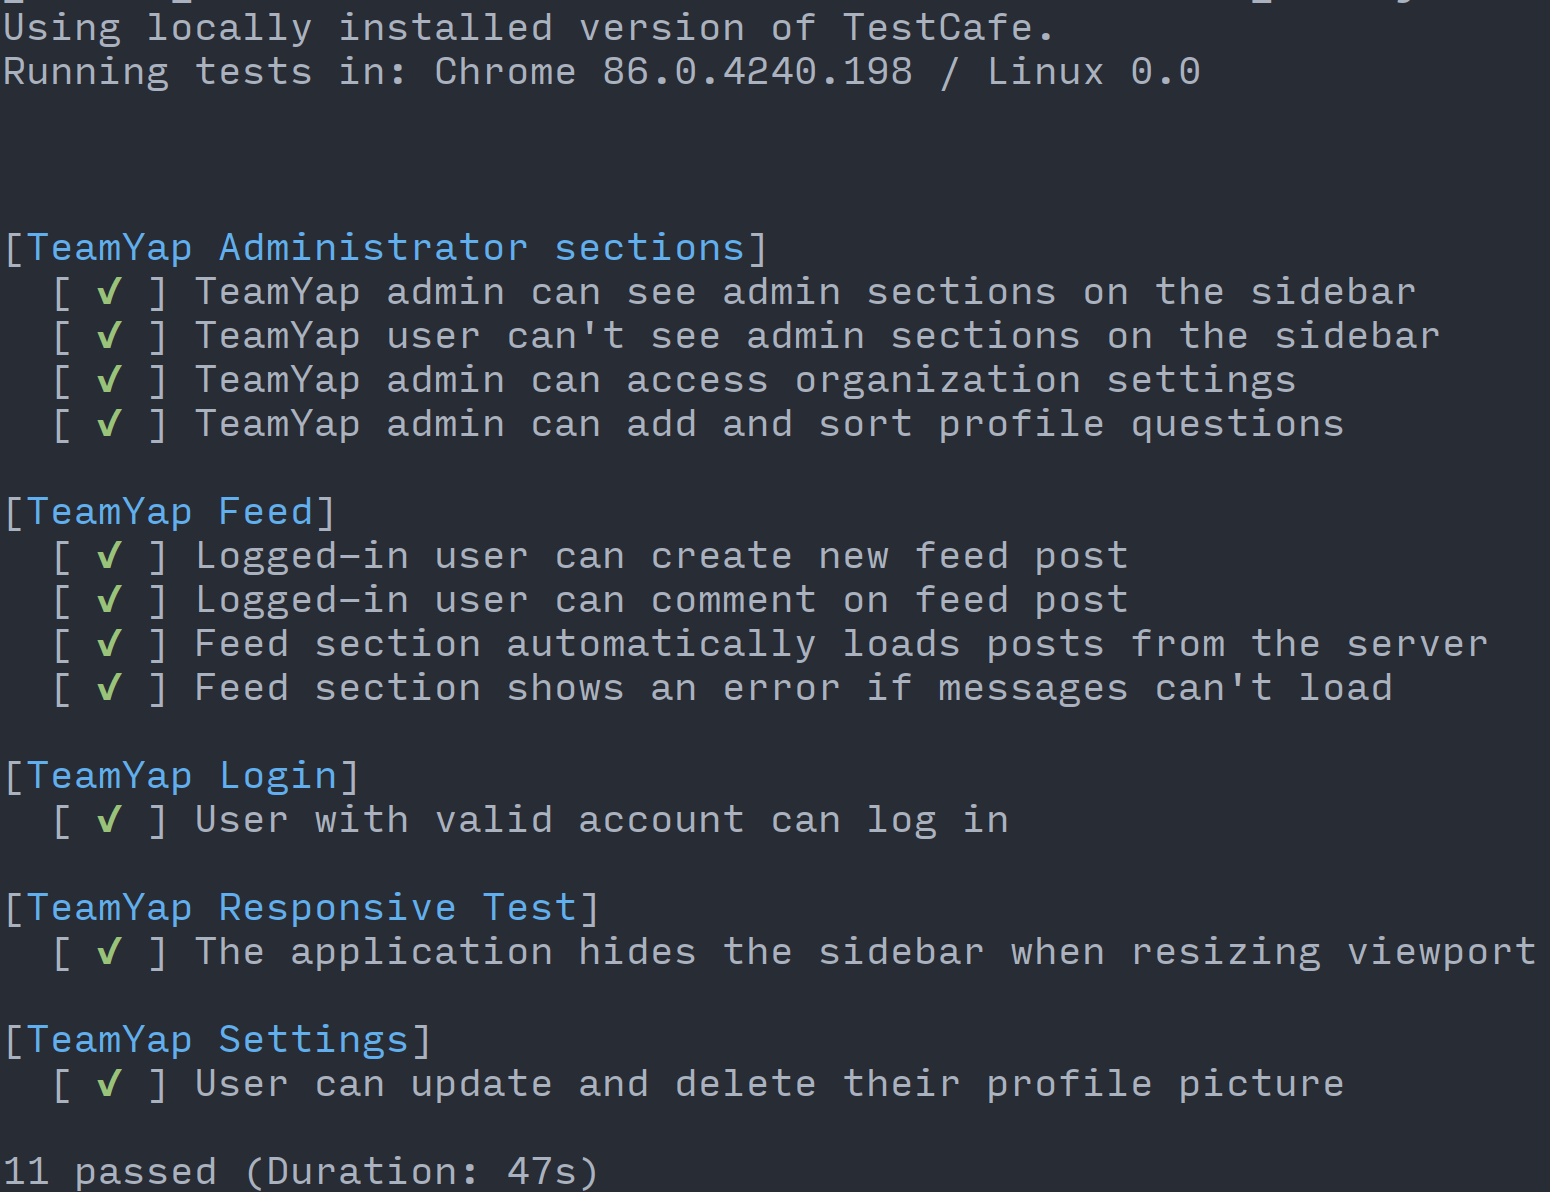
With the plugin installed and your environment variables set up, you can run your TestCafe test suite using the reportportal reporter. The easiest way to specify the reporter when executing TestCafe tests is through the command line. For instance, if you want to run your tests using Google Chrome:
testcafe chrome *_test.js --reporter reportportalThis command will execute your tests as they would typically do with the default TestCafe reporter. However, the reporter plugin will send over the test run details if the environment variable settings are correct. When starting the test run, testcafe-reporter-reportportal tells ReportPortal to create a new launch, and upon completion of each test case, it will add the result for each one to the launch.
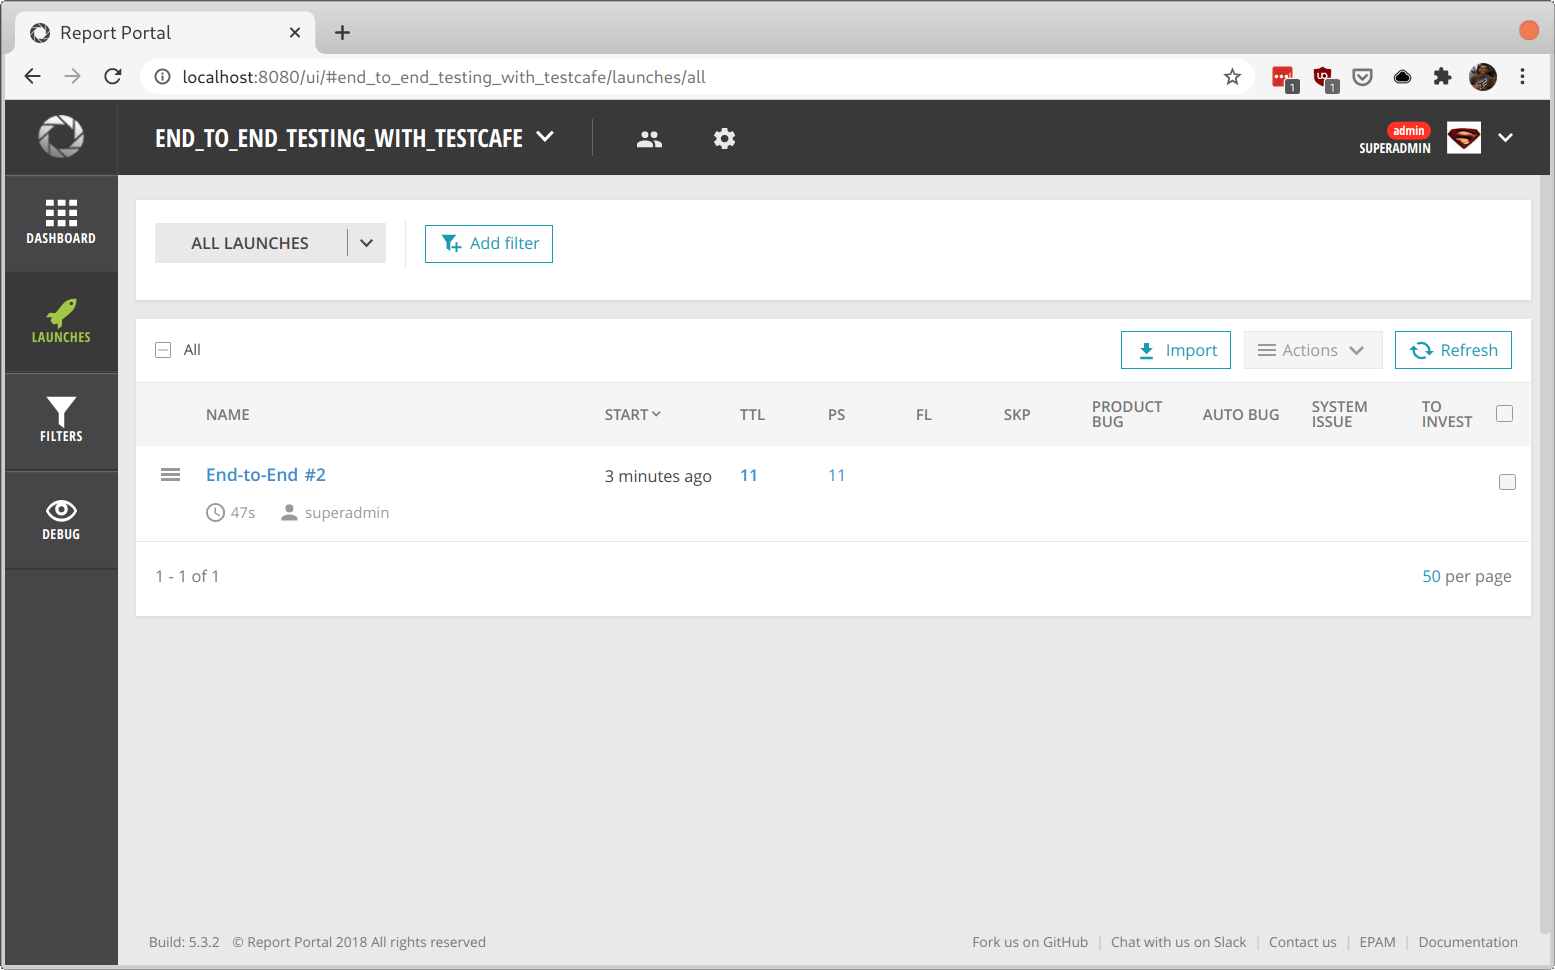
After completing the test execution, you can visit your instance of ReportPortal and see the test run under the "Launches" section:
If you go inside of the launch details, you'll see the reporter plugin properly split up your tests by fixture name, with more information on each.
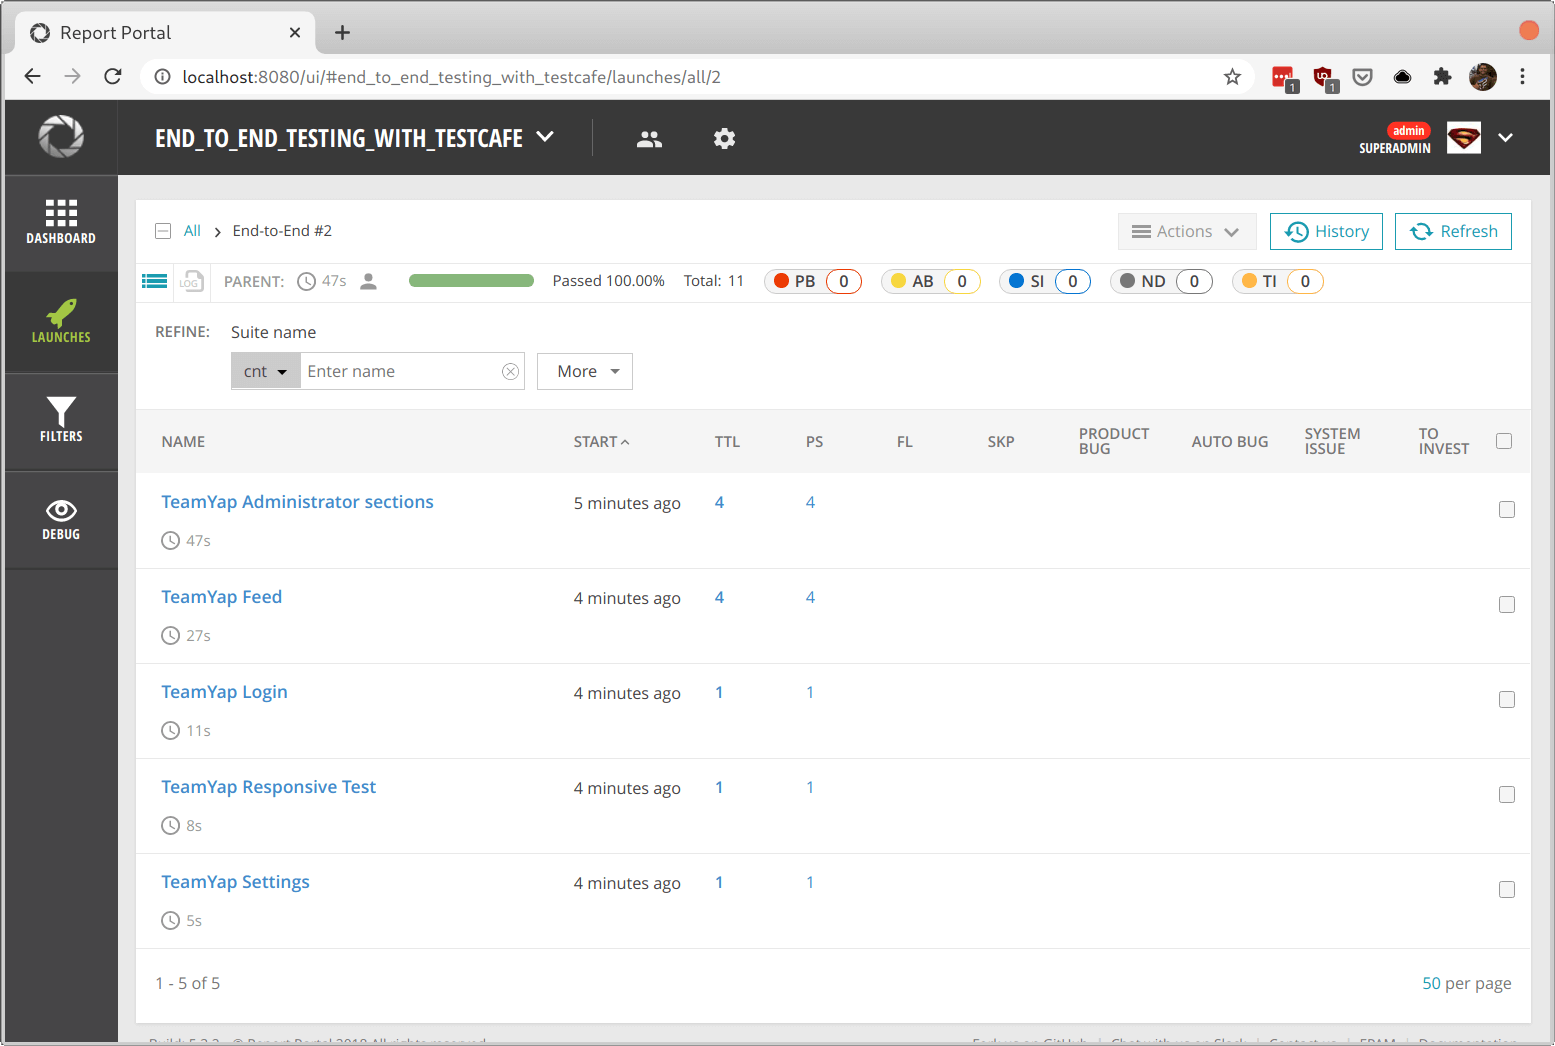
Drilling down further into each fixture will show the test case for each one.
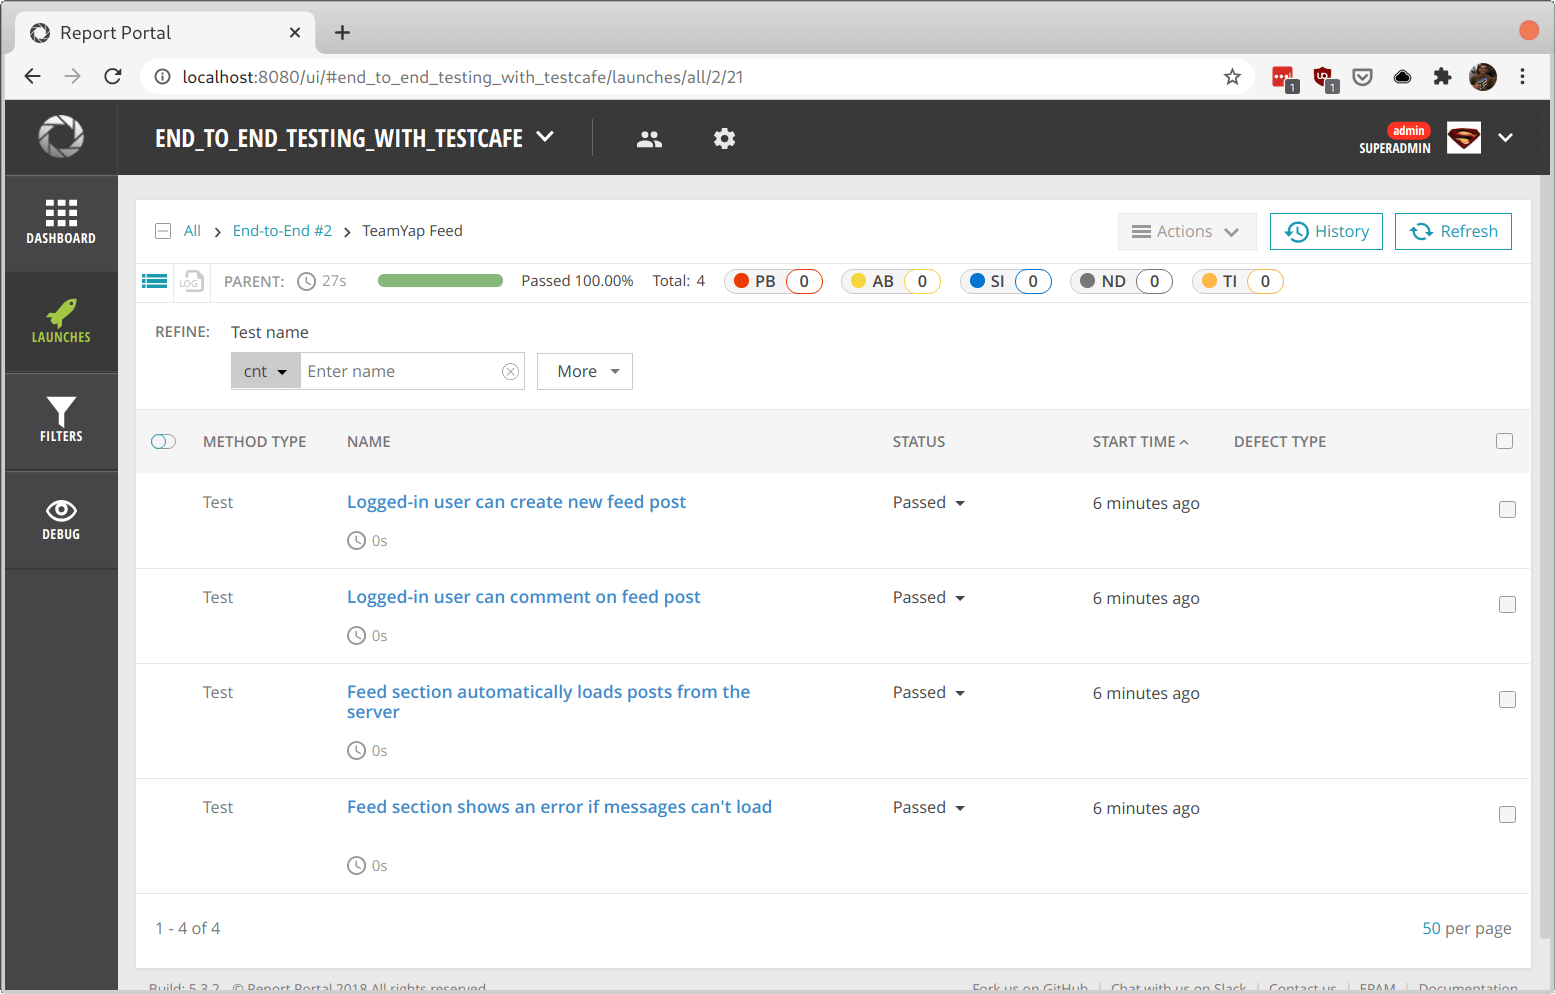
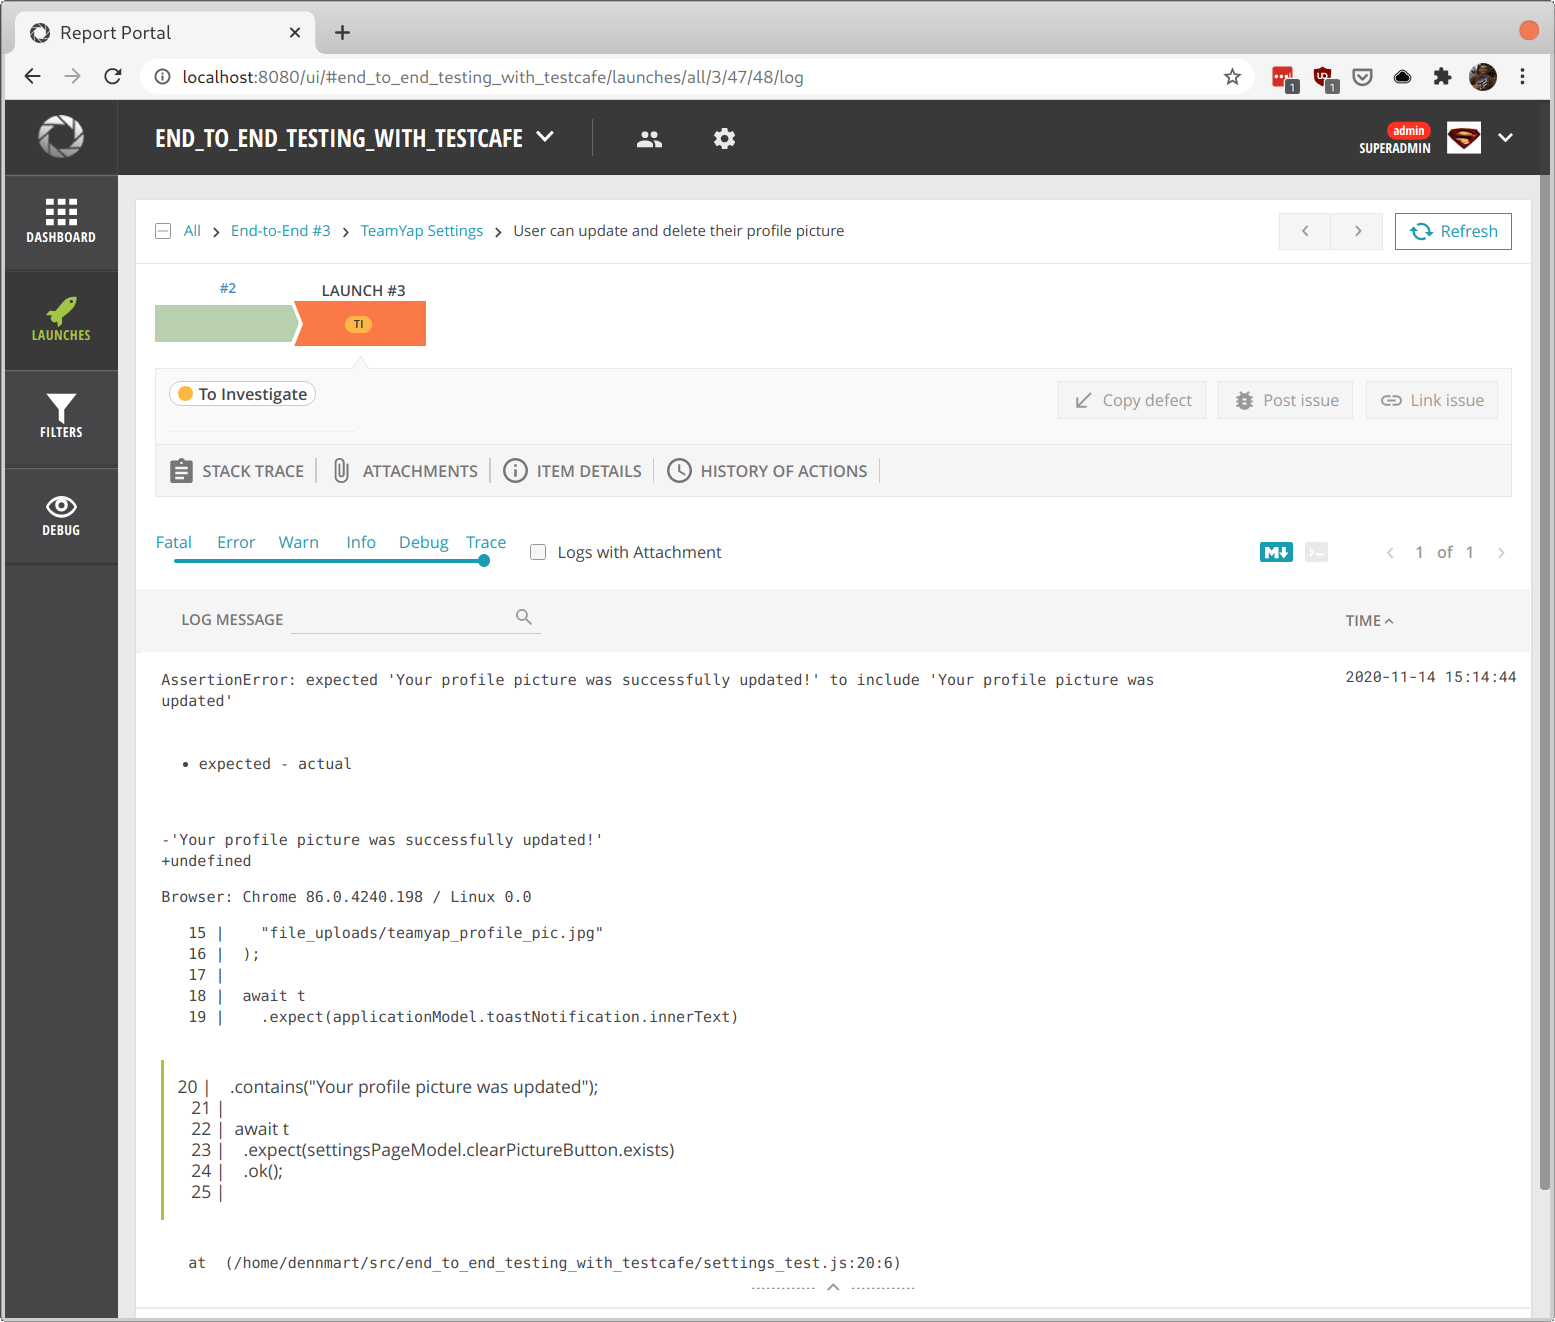
Inside each test case, you can see more information about these test cases, including a history of each time you executed the test. If your test failed, you could see the debugging information from TestCafe included right from ReportPortal.
Using your data on ReportPortal
Having your test runs and results available in ReportPortal is the first step to gaining more insight into your test suite. You can begin using this information in different ways, such as viewing the history of your test executions and filtering them by status. By itself, having this information in one place is extremely useful. But you can go beyond viewing your test executions.
One of the most useful features of ReportPortal is the customizable dashboard section. You can create different dashboards containing certain information to share with other team members. You can also create personal dashboards for your unique needs. Each dashboard includes a set of widgets that come with ReportPortal that provide real-time analysis for your launches.
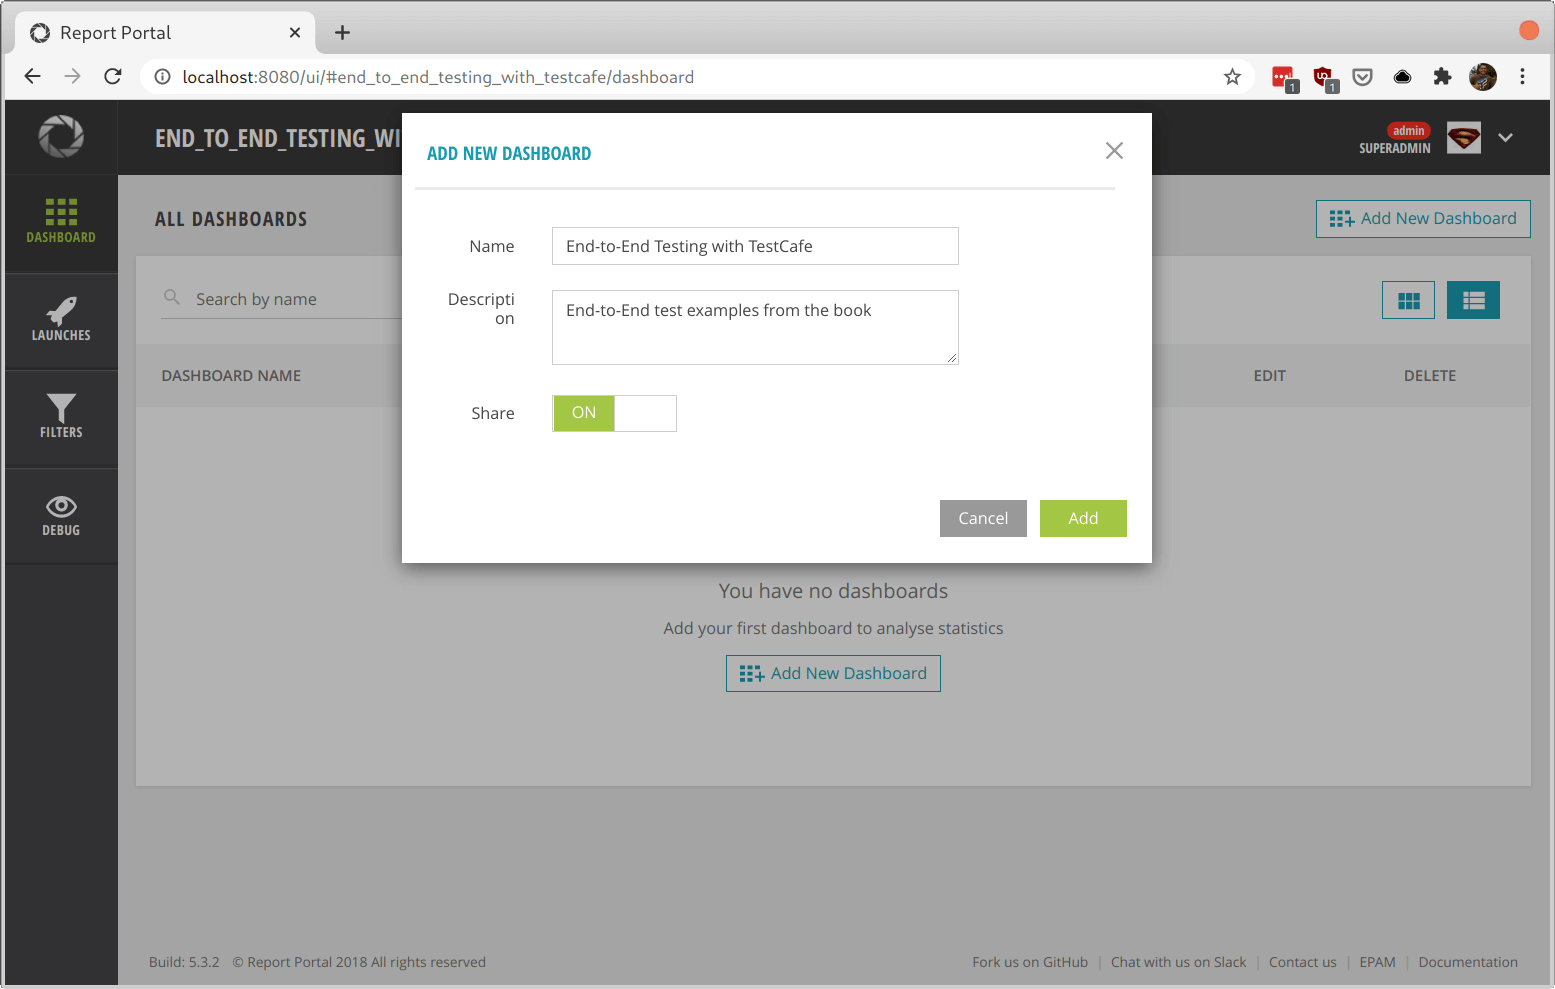
Creating a new dashboard is straightforward. In the Dashboard section of ReportPortal, click on the "Add New Dashboard" button. This button pops up a modal asking for a name and description and whether you want to share the dashboard with other team members. In this example, we'll add a shared dashboard called "End-to-End Testing with TestCafe" with a brief description.
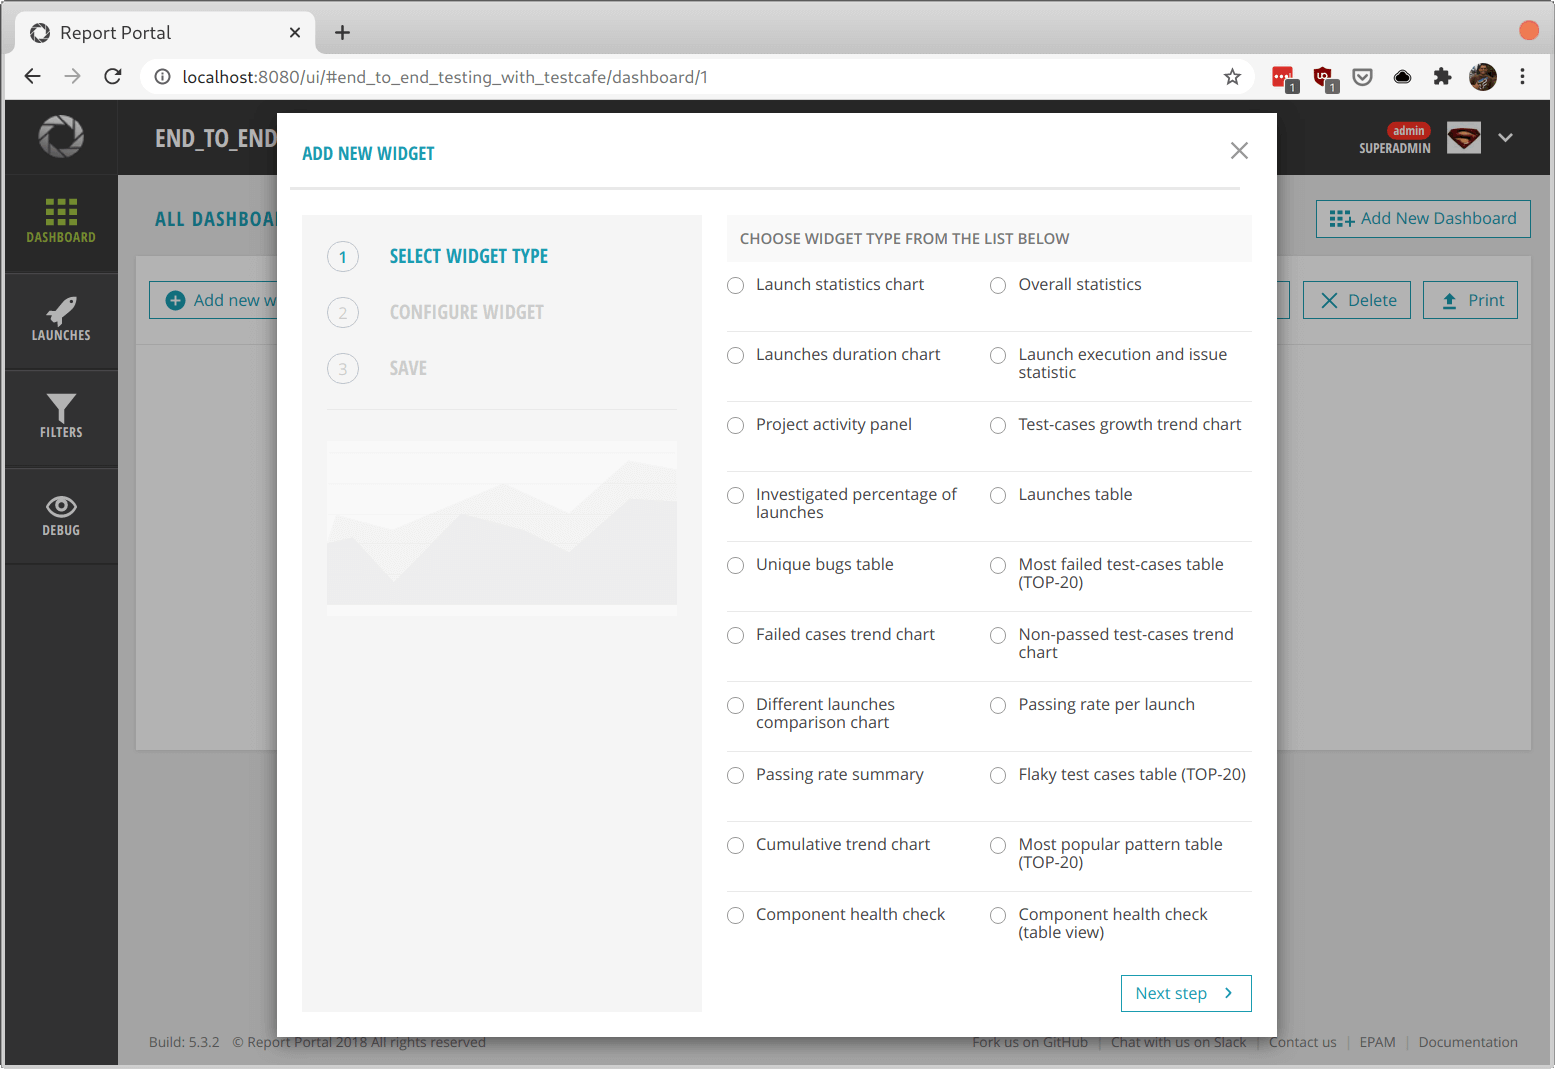
Next, you'll see a list of widgets you can include in your new dashboard. Clicking on any option will give you a brief description of the widget and a sample image of how it would look. Here, we'll choose the "Overall statistics" widget, which summarizes test cases and their statuses and labels.
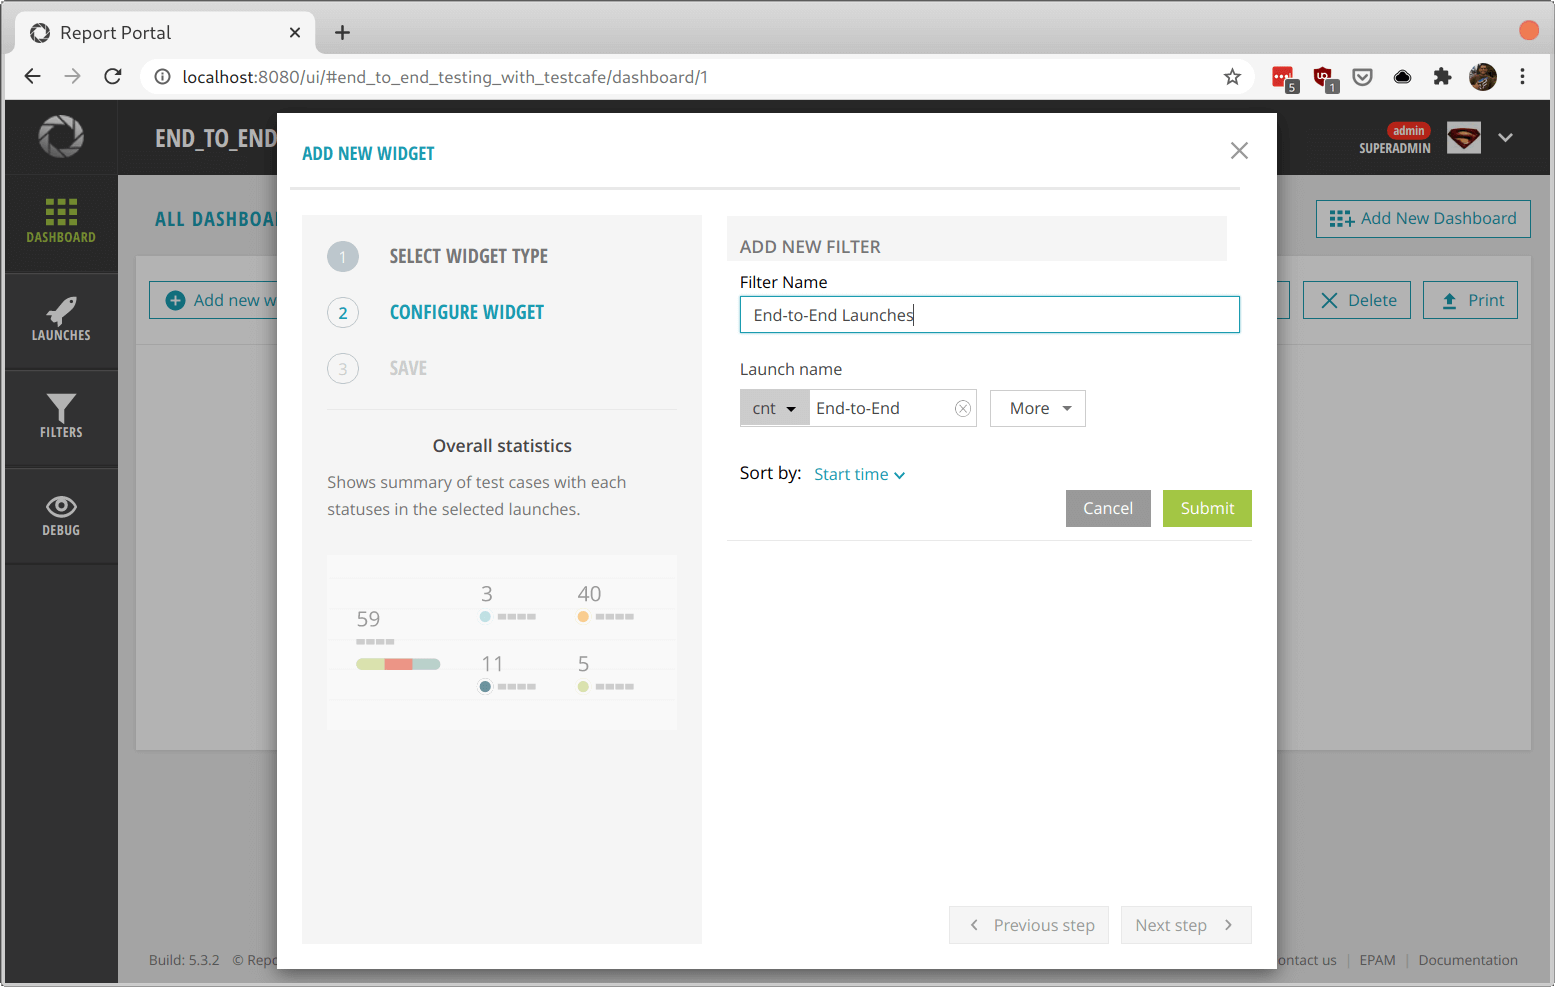
After selecting your widget, you'll get asked for a filter. You'll need to add at least one filter to tell ReportPortal which data to use for the widget. If you haven't set up a filter yet, you can add a new one on this screen.
Filters allow you to select which kinds of tests you want to use for the widget. You can filter by different attributes like launch names, tags, and more. For this widget, we'll filter by launch name, containing the term "End-to-End".
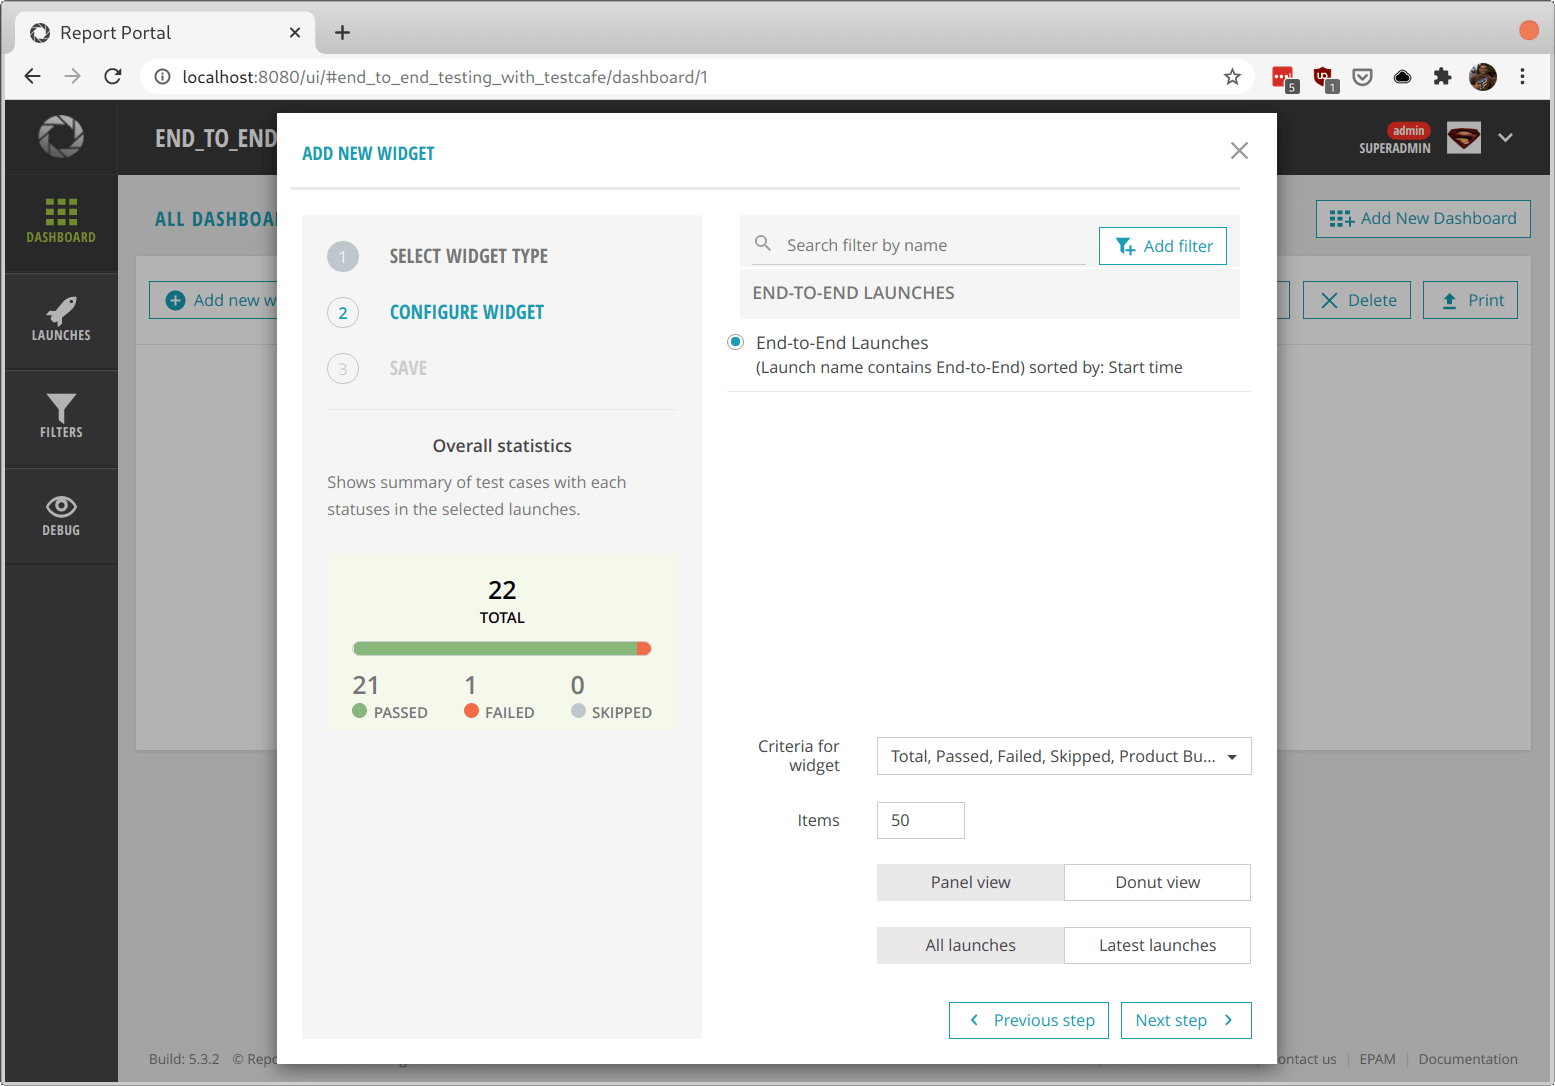
After the filter gets created and selected, you can then use it to configure your widget. Here, you can further limit the data you want to show. Each widget contains different configuration settings. For the "Overall statistics" widget, you can select the test criteria (passed, failed, skipped, and so on), limit the shown items, and how you want to display its graphs.
Once the widget type and filter are selected and configured, you can add the widget to your dashboard with a name and description. Once added, it will appear on the dashboard immediately.
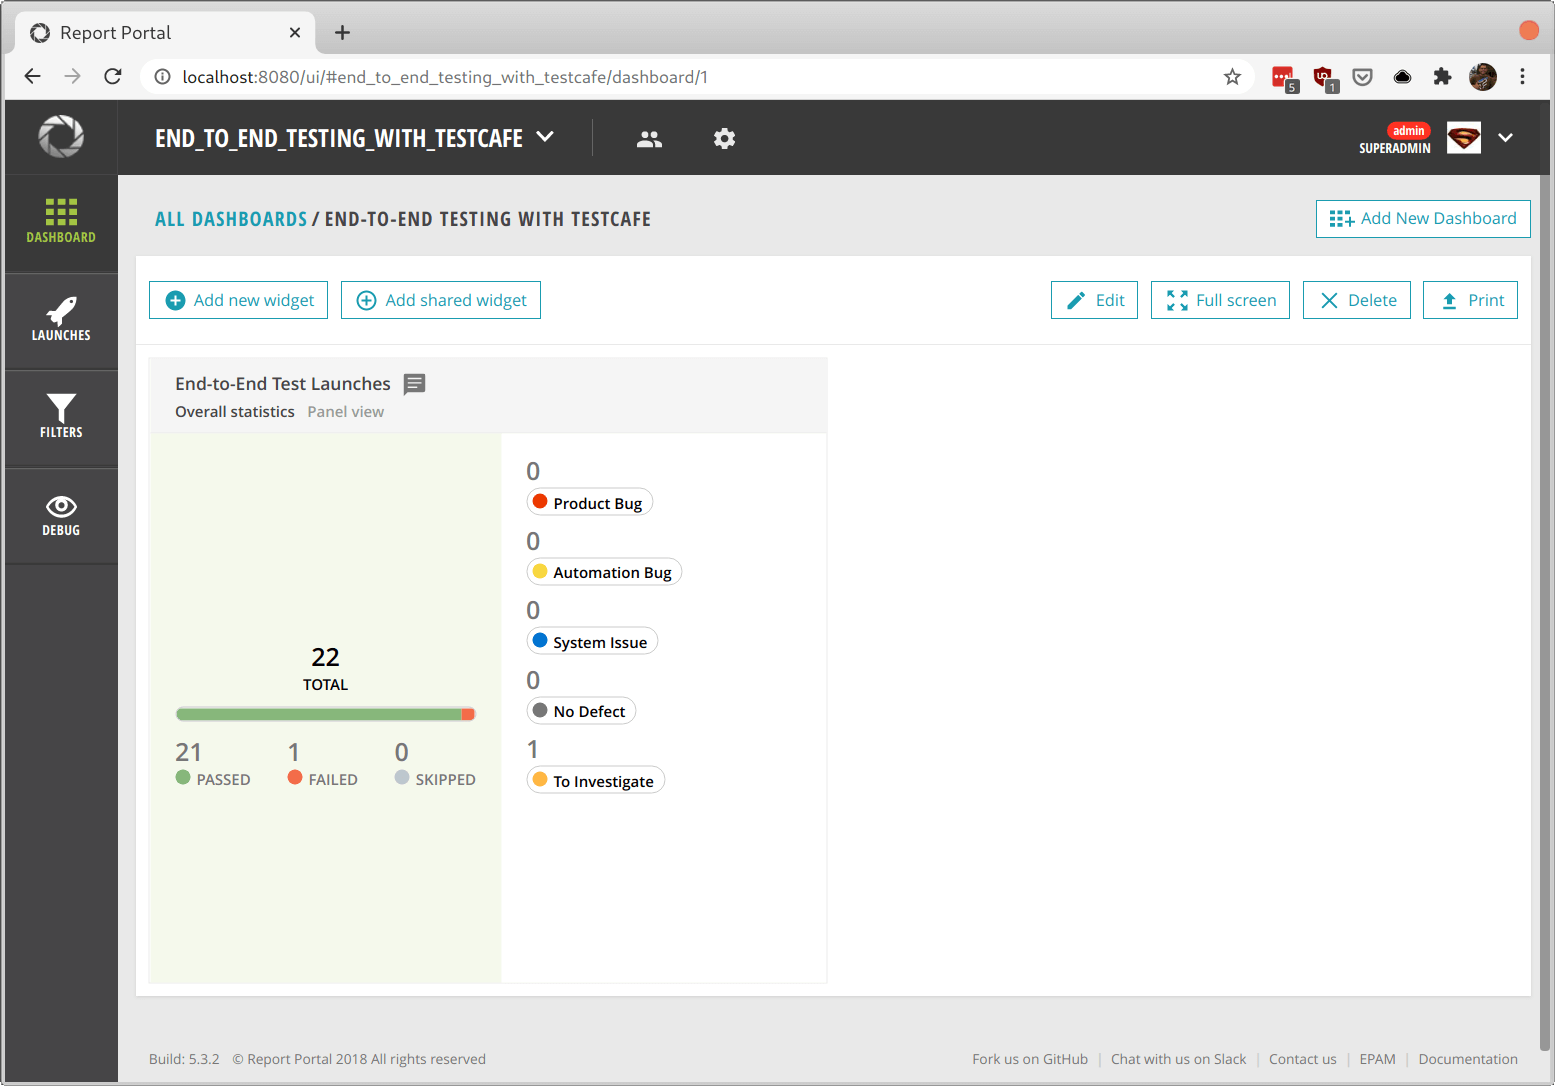
From here, you can add as many widgets as you need, each with its own configuration, to get an even clearer picture of your test automation. You can even add the same widgets with different settings and filters. The dashboard also allows you to resize and drag each widget to your preferred setup.
Summary
Keeping track of your work is a crucial component in maintaining a healthy test automation environment. You need to know what's going on at any given moment in your test suite and have the ability to respond to any potential problems that come up. Without any insight into your tests, you'll waste tons of time digging for solutions when the inevitable issue pops up.
ReportPortal is an excellent open-source tool that allows you to have a single place to store your test execution results. It also allows you to view and analyze your test runs in many ways through its customizable dashboard and machine learning capabilities. With this tool, you'll always have answers to your main test automation questions within reach.
This article shows how easy it is to use ReportPortal with the TestCafe end-to-end testing framework. If you don't use TestCafe, the article demonstrates how easy you can integrate most testing tools to begin gathering data as quickly as possible. With lots of official support for the most popular testing libraries, as well as plenty of user-contributed plugins, you'll likely find the integrations for your testing projects.
Test automation dashboards and aggregators like ReportPortal are under-used in most places. Hopefully, this article presents a few ideas to get you thinking about how useful these services can be for your organization. Remember that what doesn't get measured will never get improved.
How do you keep track of your test automation results? Leave a comment below and share your tools with others!

